Creating a campaign with a KPI
Creating a basic campaign on Metrom is straightforward, as covered in creating a campaign. Launching one with an attached KPI is just as easy. For a quick refresher on KPIs, check out KPI based liquidity mining.
Configuration
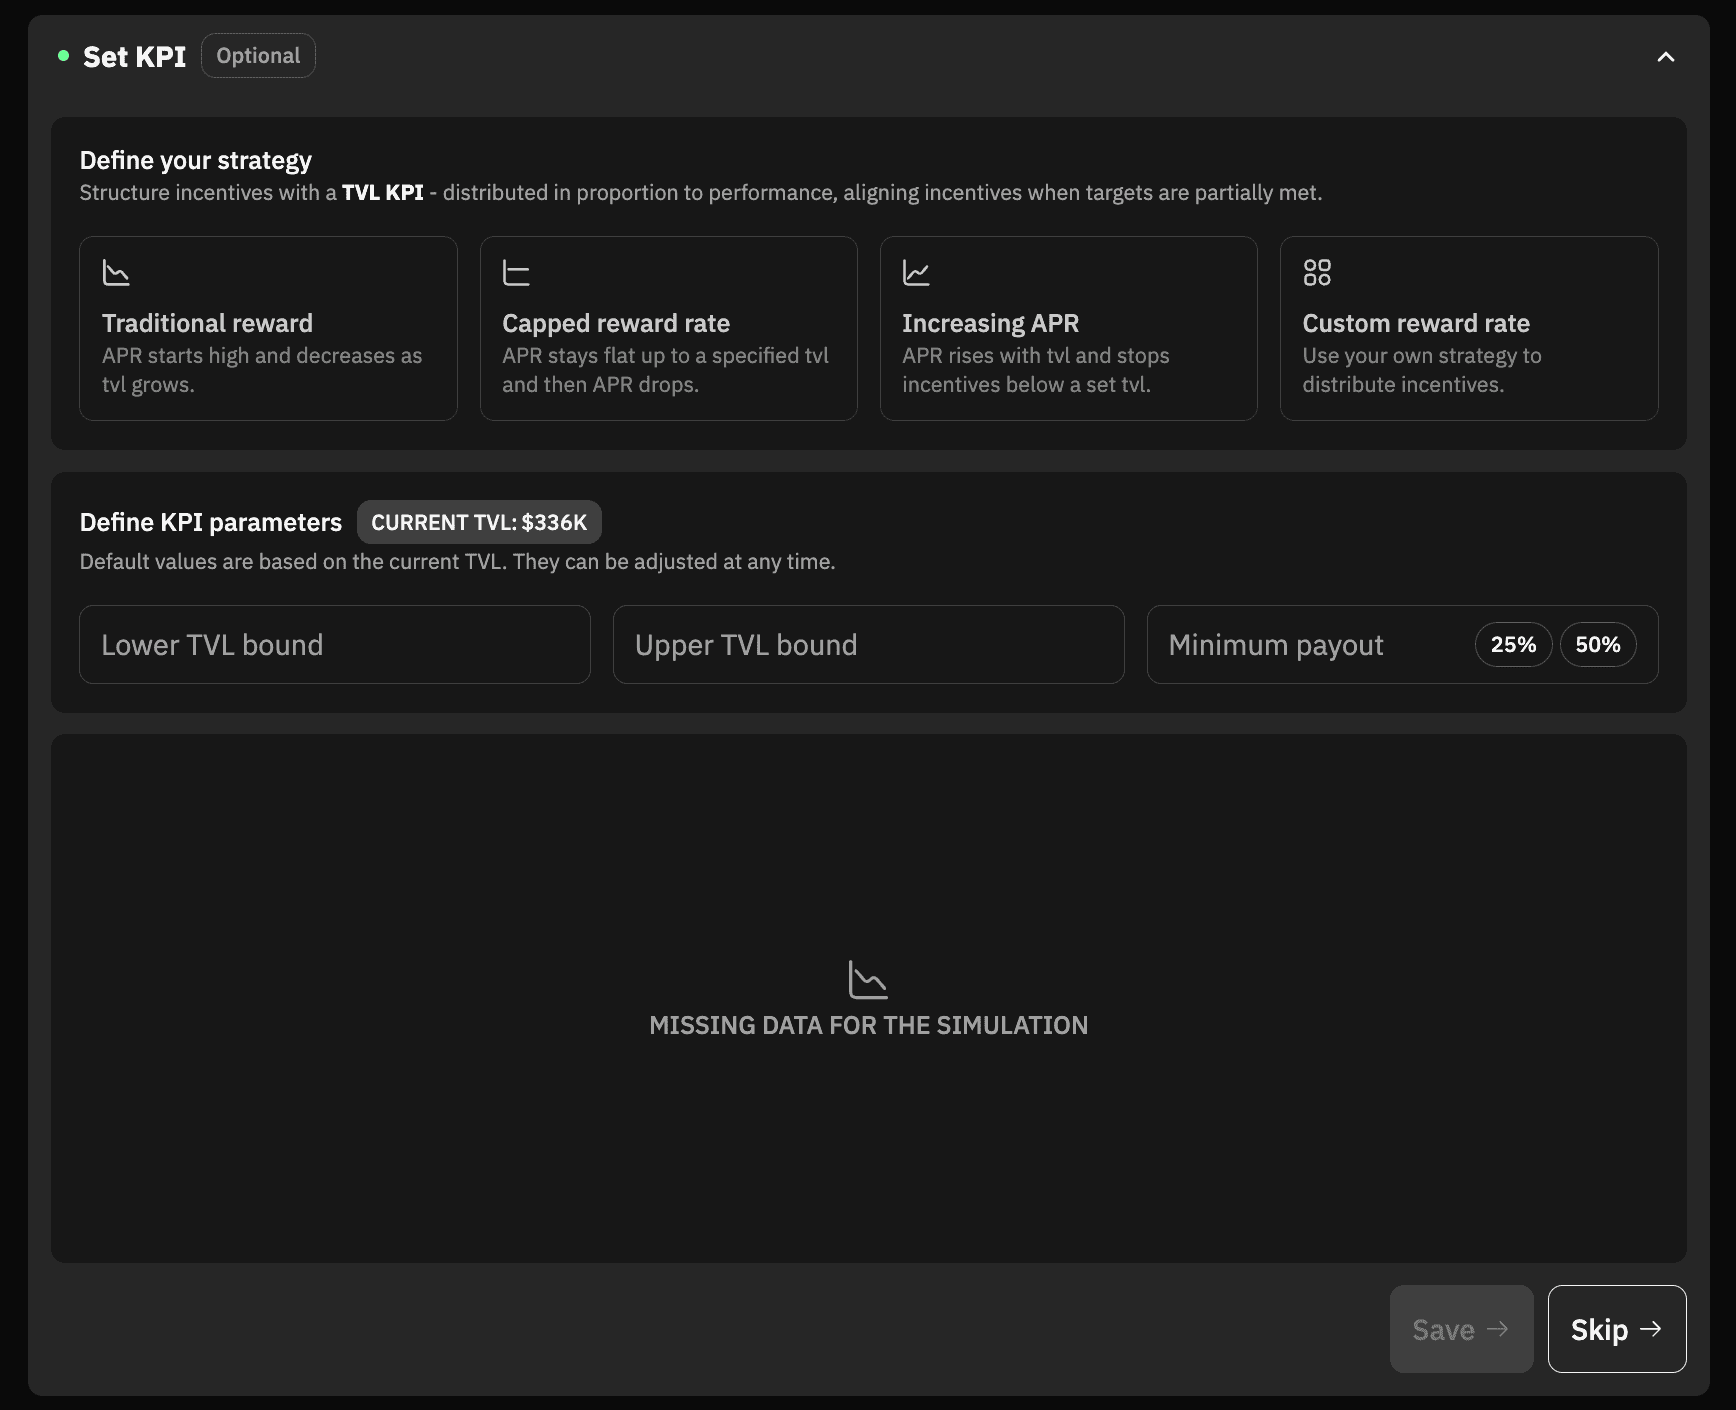
Once all the required steps are completed, it’s time to configure the KPI and explore the available configuration options.
-
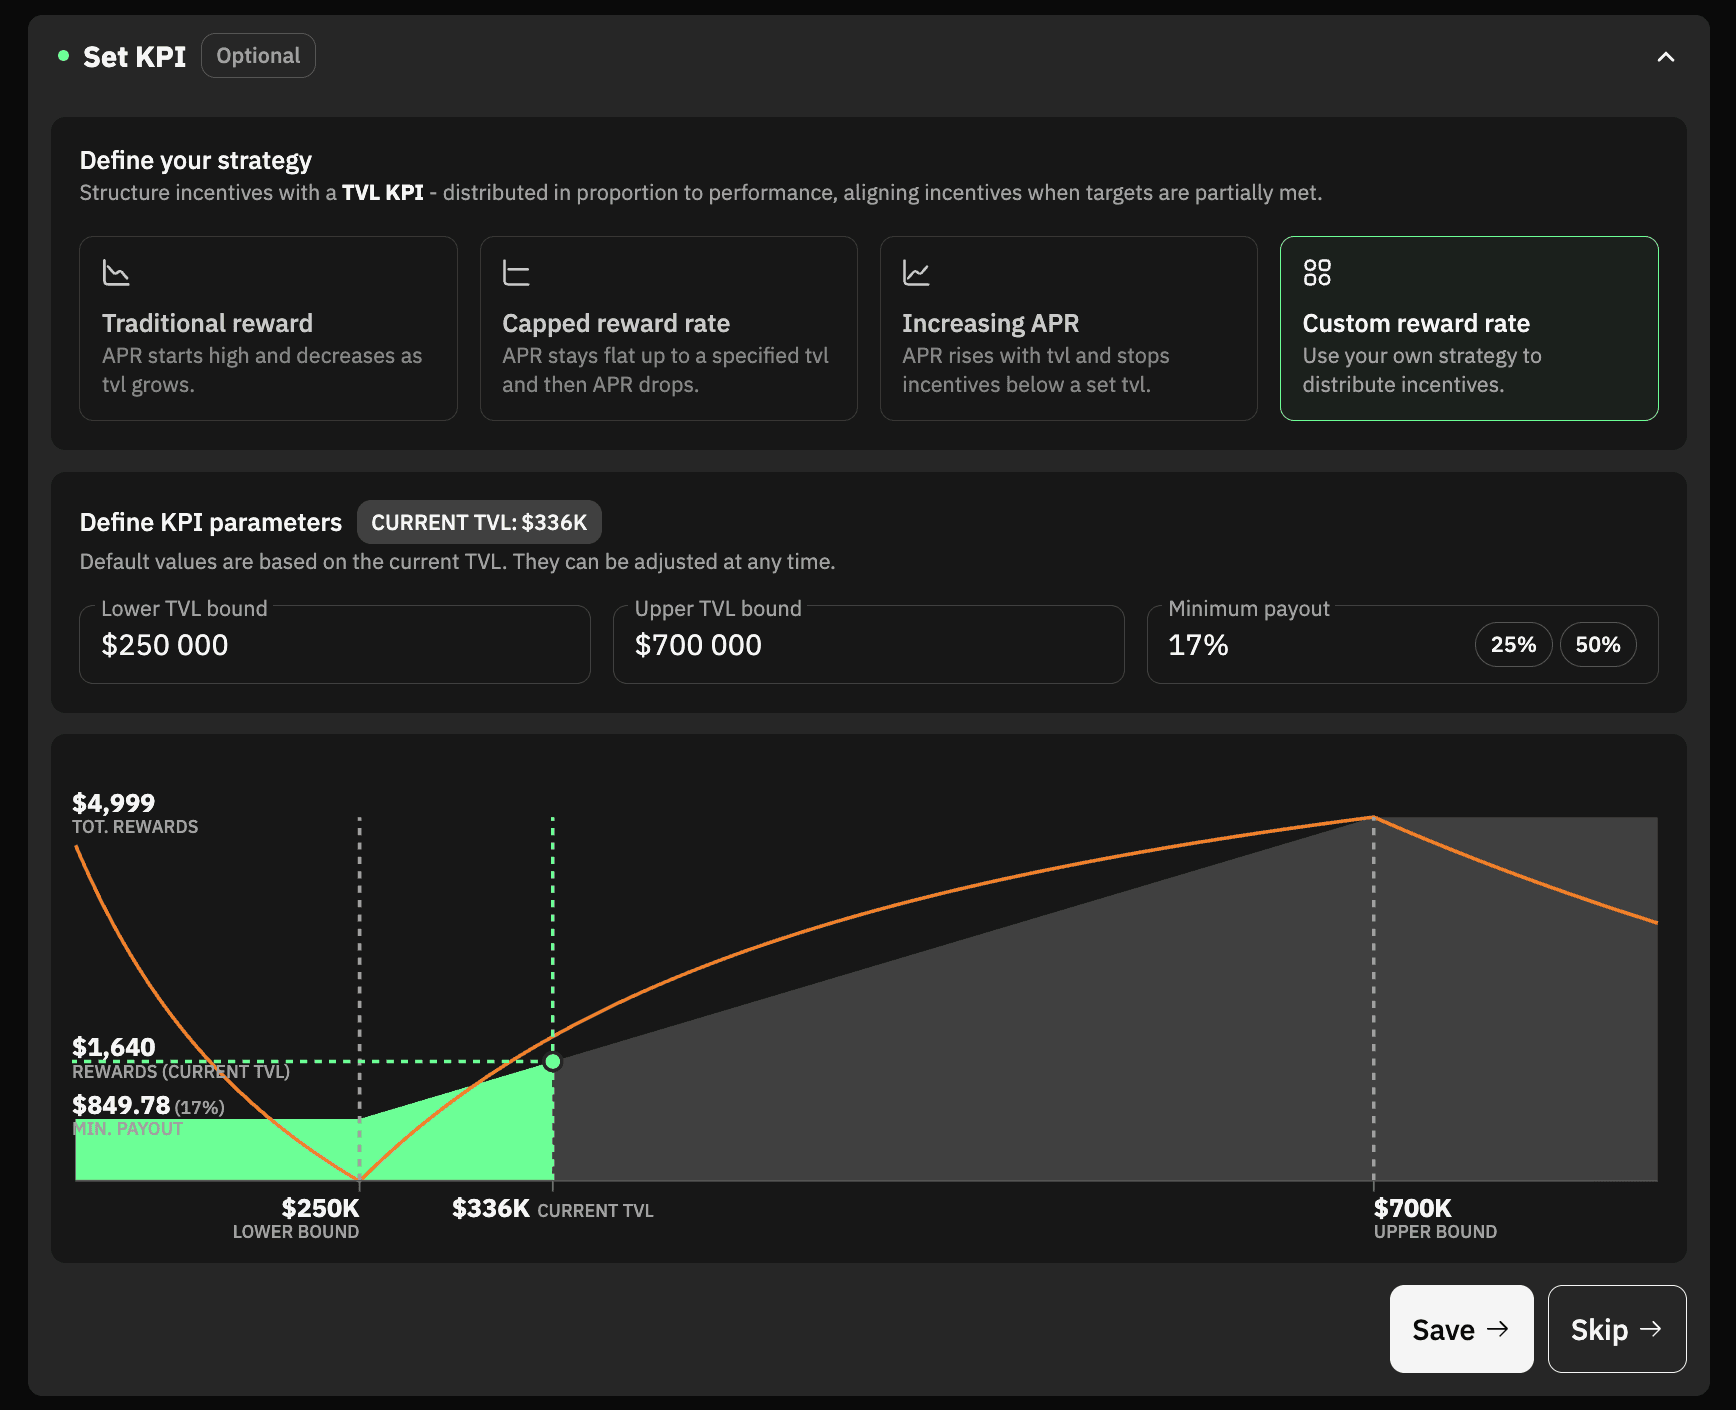
Current TVL: Represents the most recent total value locked in the selected pool, which is being incentivized.
-
Lower and upper bounds: These values allow you to customize the incentivization strategy by restricting reward distribution to a specific TVL range. For inspiration, check out the KPI usecases.
-
Minimum payout: This is the percentage of rewards that will be distributed to LPs, regardless of the KPI.
Define your strategy
Metrom provides four reward distribution strategies for KPI campaigns. Each one shapes how APR behaves as TVL moves inside the bounds you set.
Traditional reward
APR starts high when TVL is low and decreases as TVL grows.
Best for bootstrapping liquidity quickly. Early LPs see strong yields, and emissions taper as the pool fills up, keeping the cost of acquiring each marginal dollar of liquidity in check.
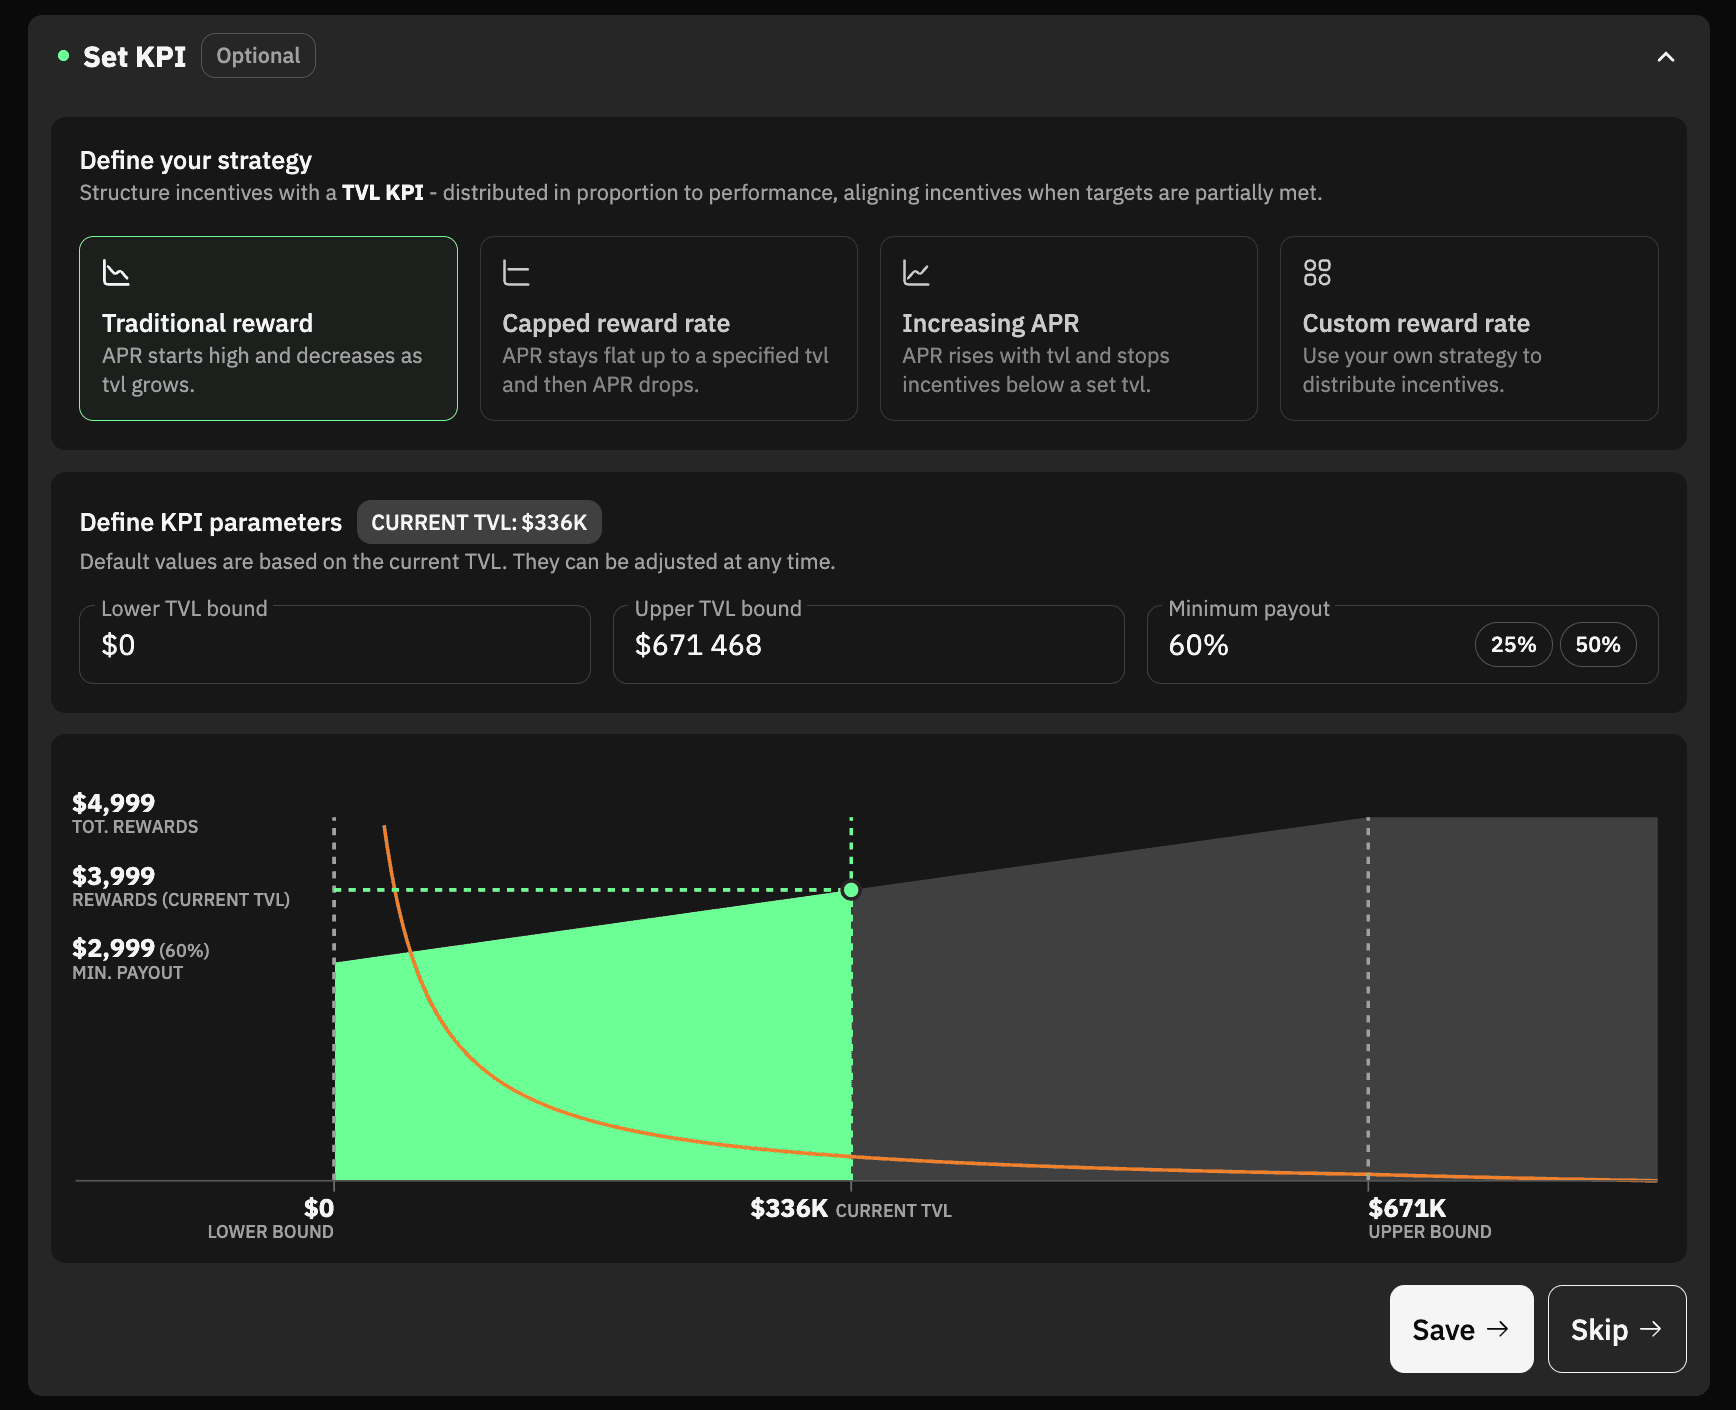
Capped reward rate
APR stays flat up to a specified TVL, then drops past that point.
Best for predictable yields up to a known target. Once TVL crosses the upper bound, additional liquidity earns less, which discourages overshooting and reduces wasted emissions on excess capital.
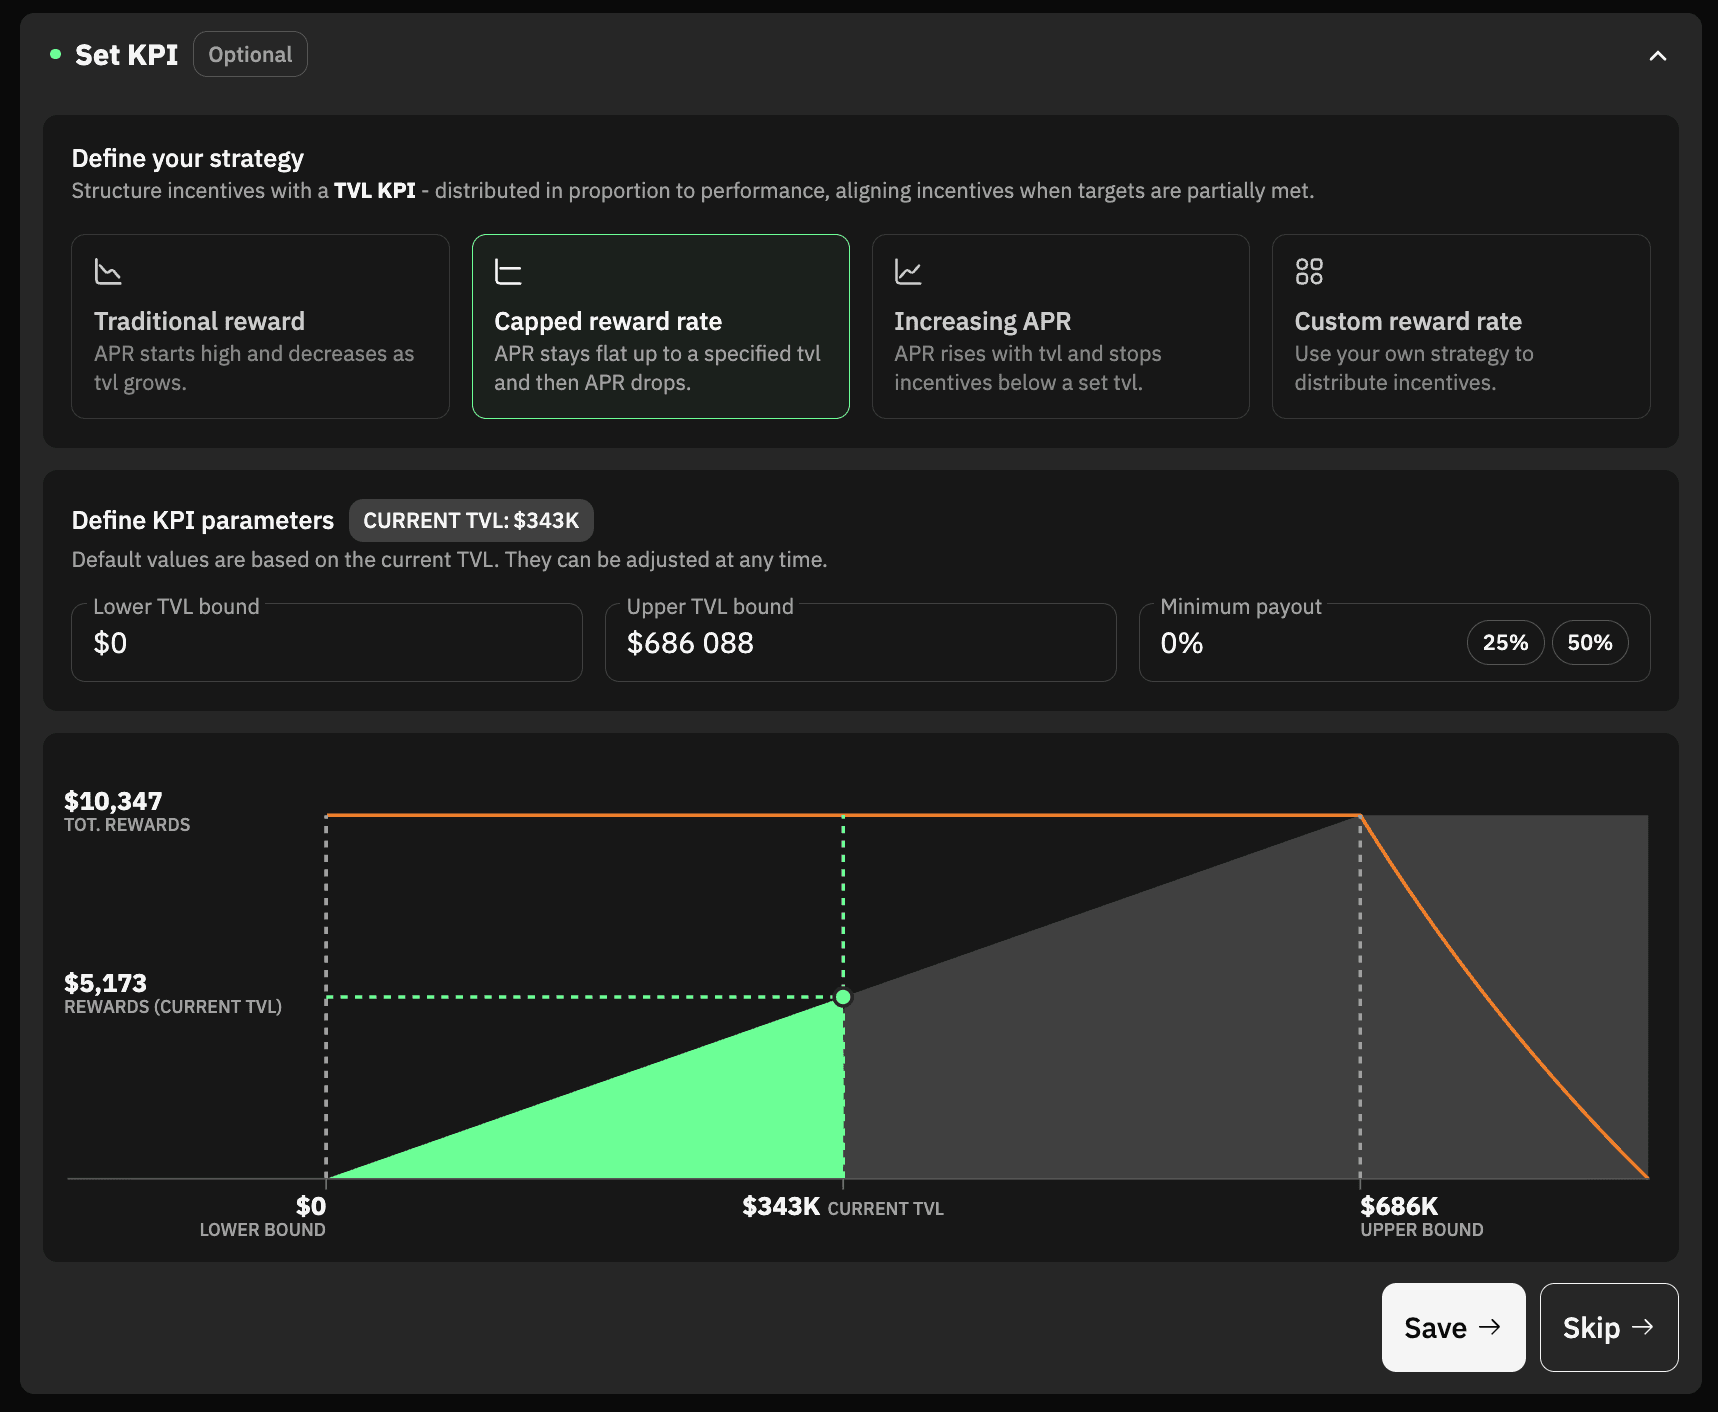
Increasing APR
APR rises with TVL and stops paying rewards below a set TVL.
Best for protocols that need to hit a minimum scale before incentives kick in. The APR climbs as more liquidity is added, rewarding LPs more as the pool gets healthier.
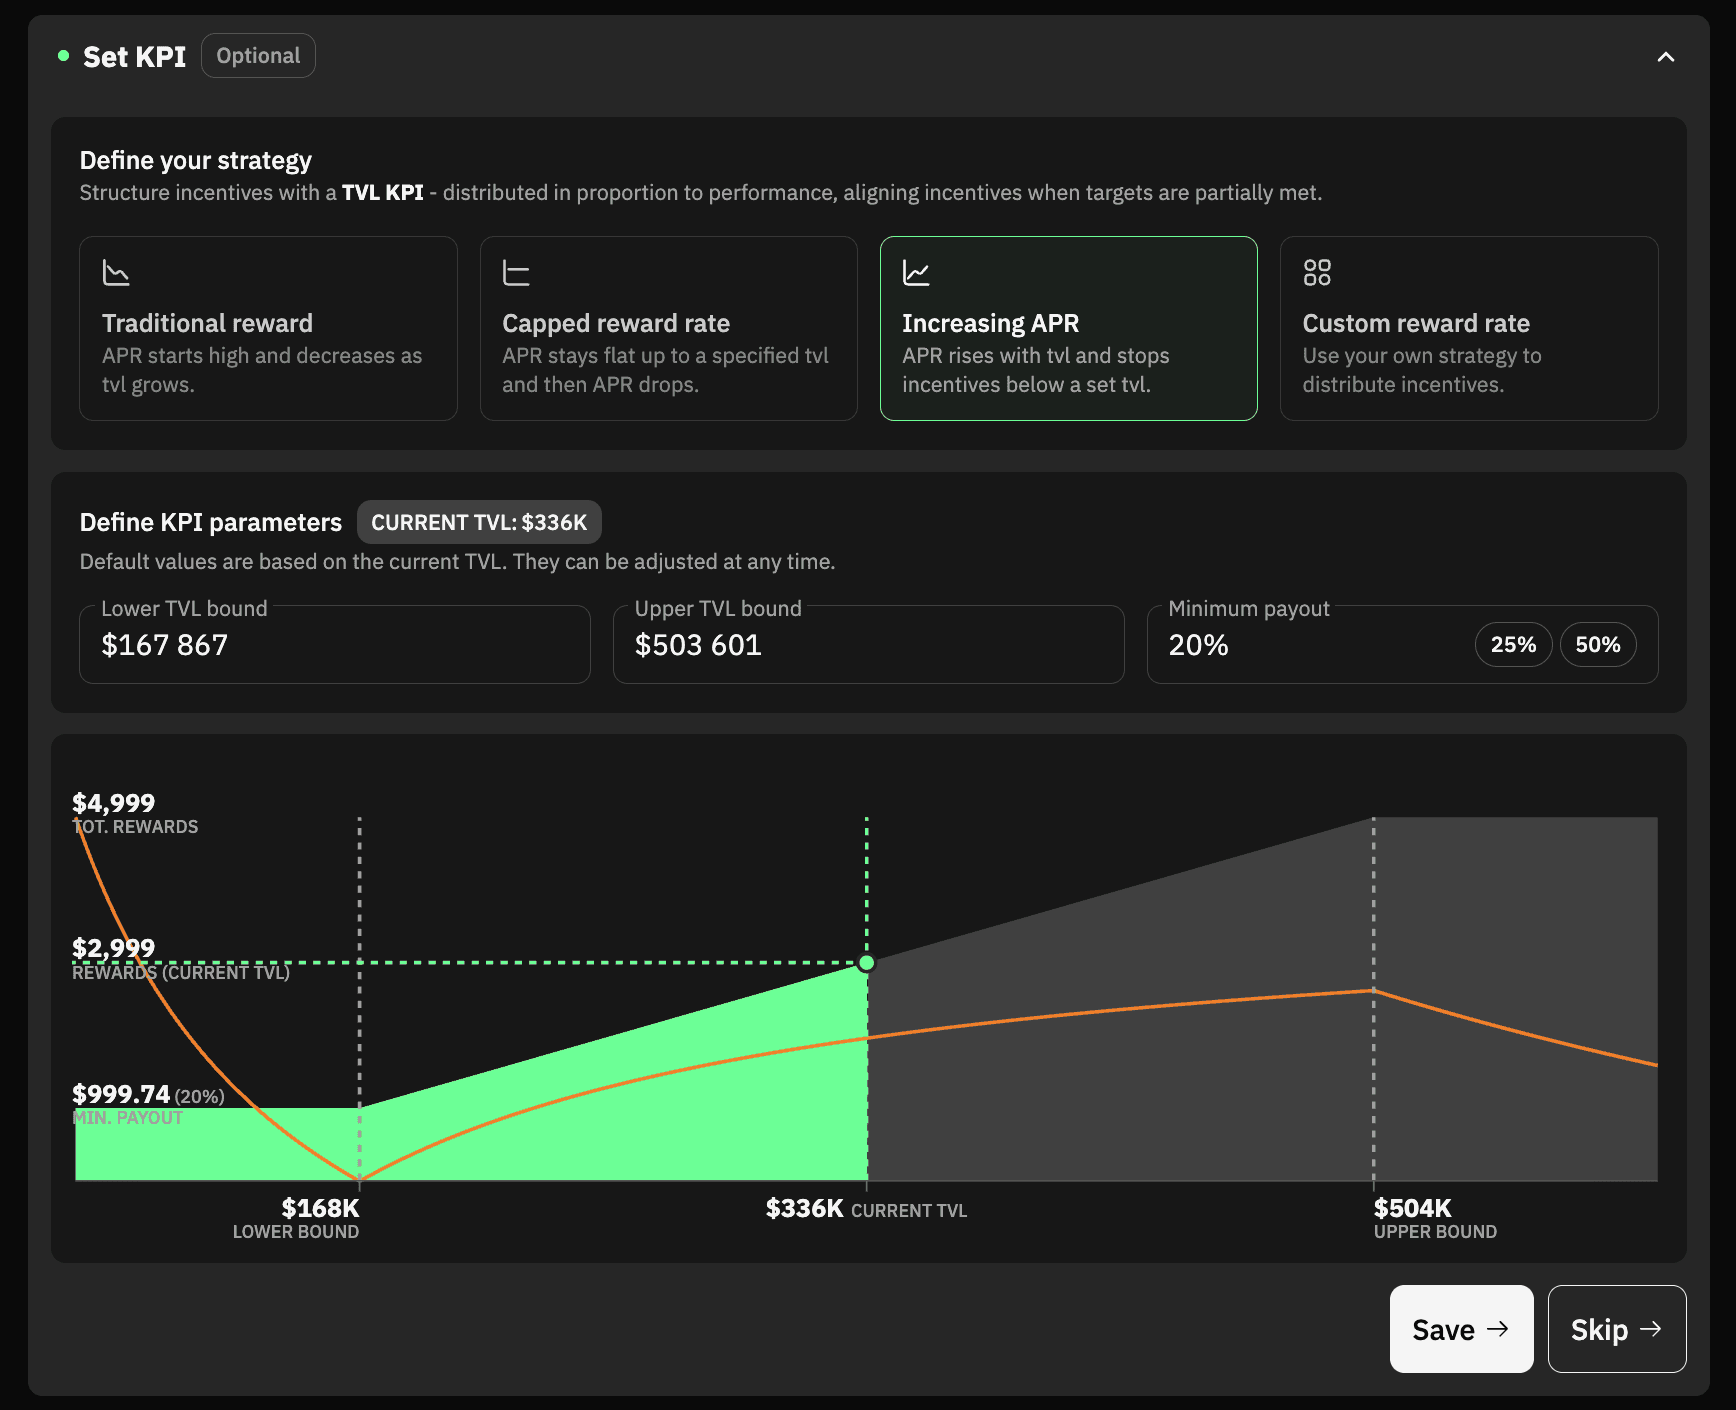
Custom reward rate
Use your own curve to shape how rewards are distributed across the TVL range.
Best for protocols with specific incentive logic that doesn’t fit the three presets. You define the distribution behavior end to end.
The simulation chart updates live as you adjust the strategy and parameters. It shows two things:
- The APR curve in orange, plotted against TVL.
- The rewards distribution area in green, showing how much of the total reward pool is paid out at each TVL level.
Here as an example we have set a custom reward curve for a pool with a lower bound of
$250,000 and an upper bound of $700,000, with a 17% minimum payout.
Use the simulation to sanity-check the curve before saving. If it shows
MISSING DATA FOR THE SIMULATION, fill in the bounds and minimum payout so the
chart can compute the projection.
Once you’re satisfied with the KPI setup, save the changes and head to see campaign preview, where you can review all the details.
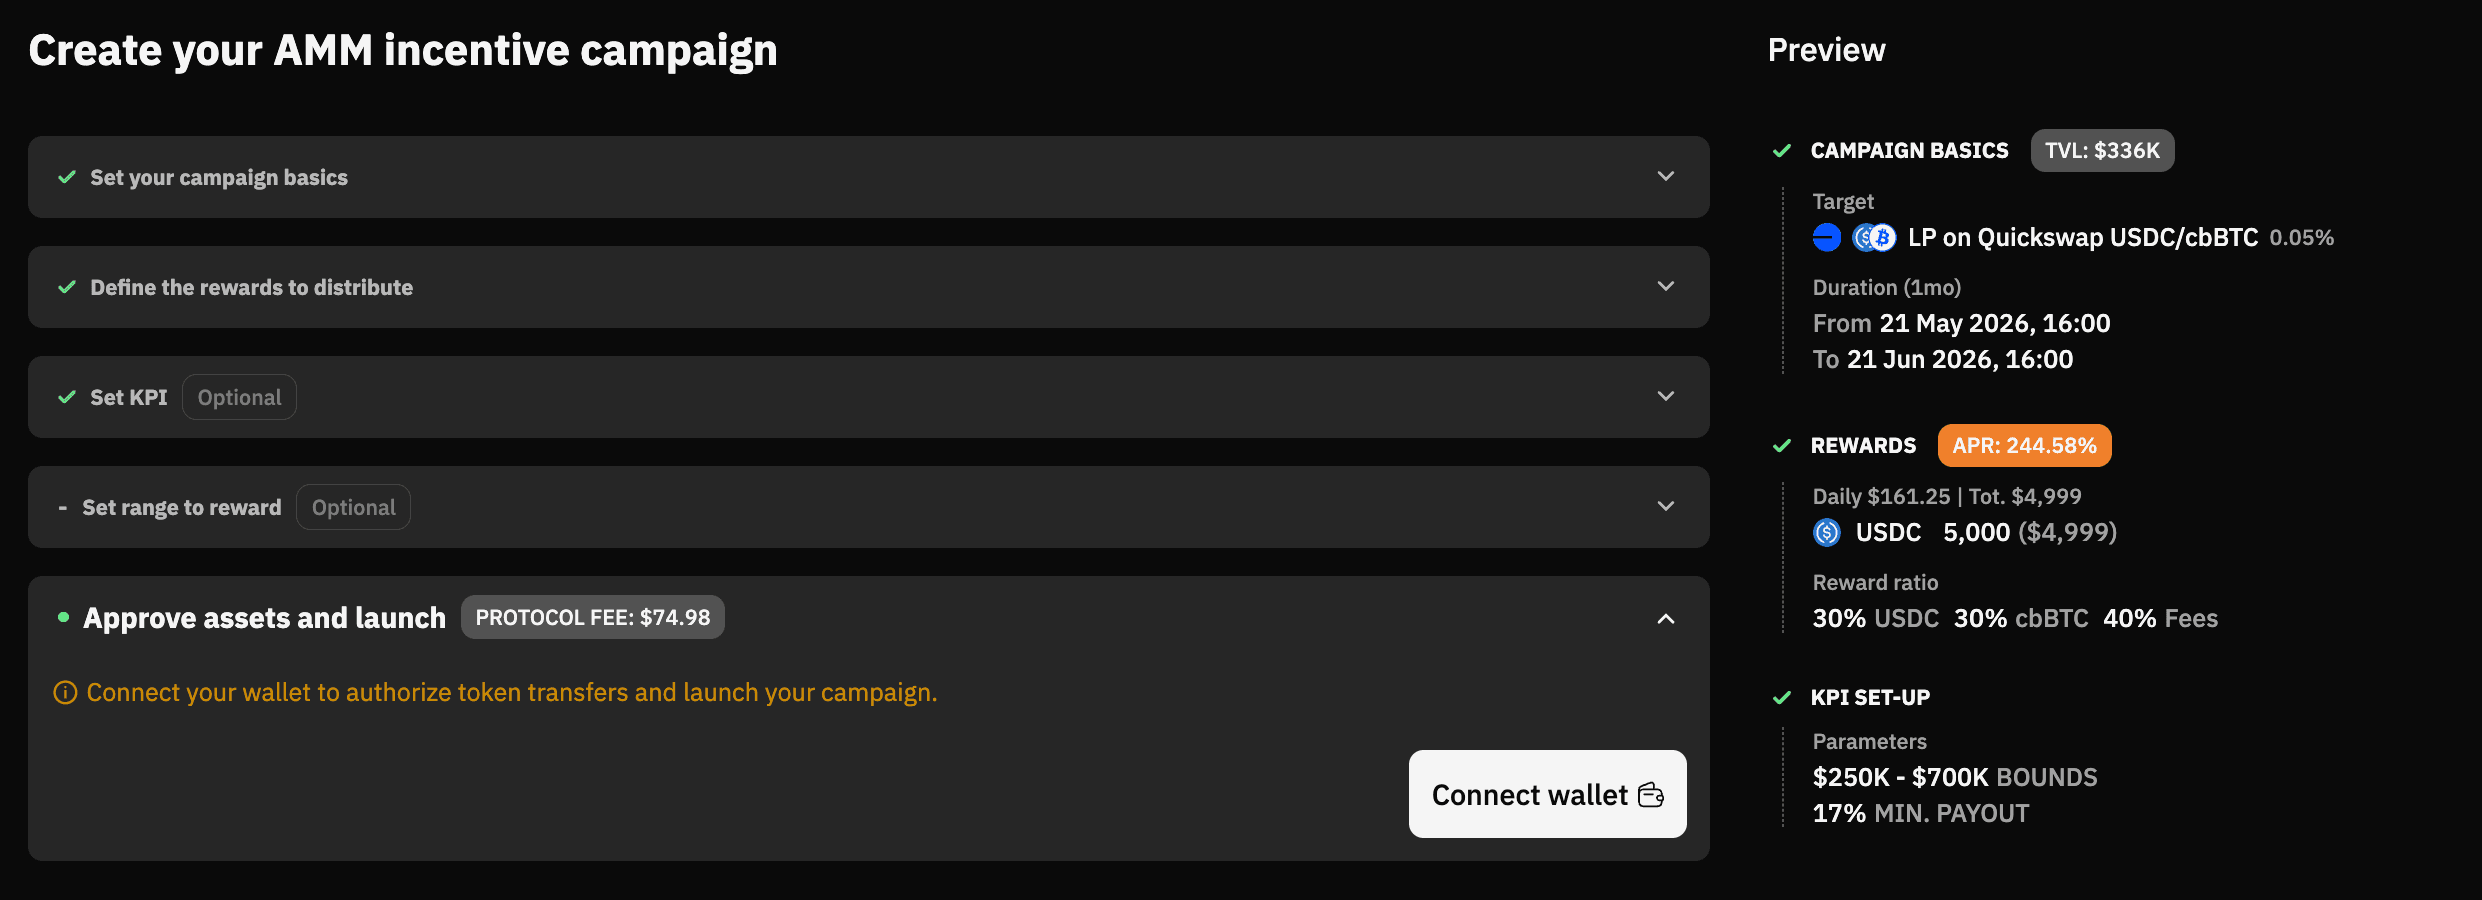
Connect wallet to transfer reward tokens and launch the campaign.
Ready to deploy? Head over to your dashboard and flip on Set KPI.
Need help? Join the conversation in our Discord or email hello@metrom.xyz.